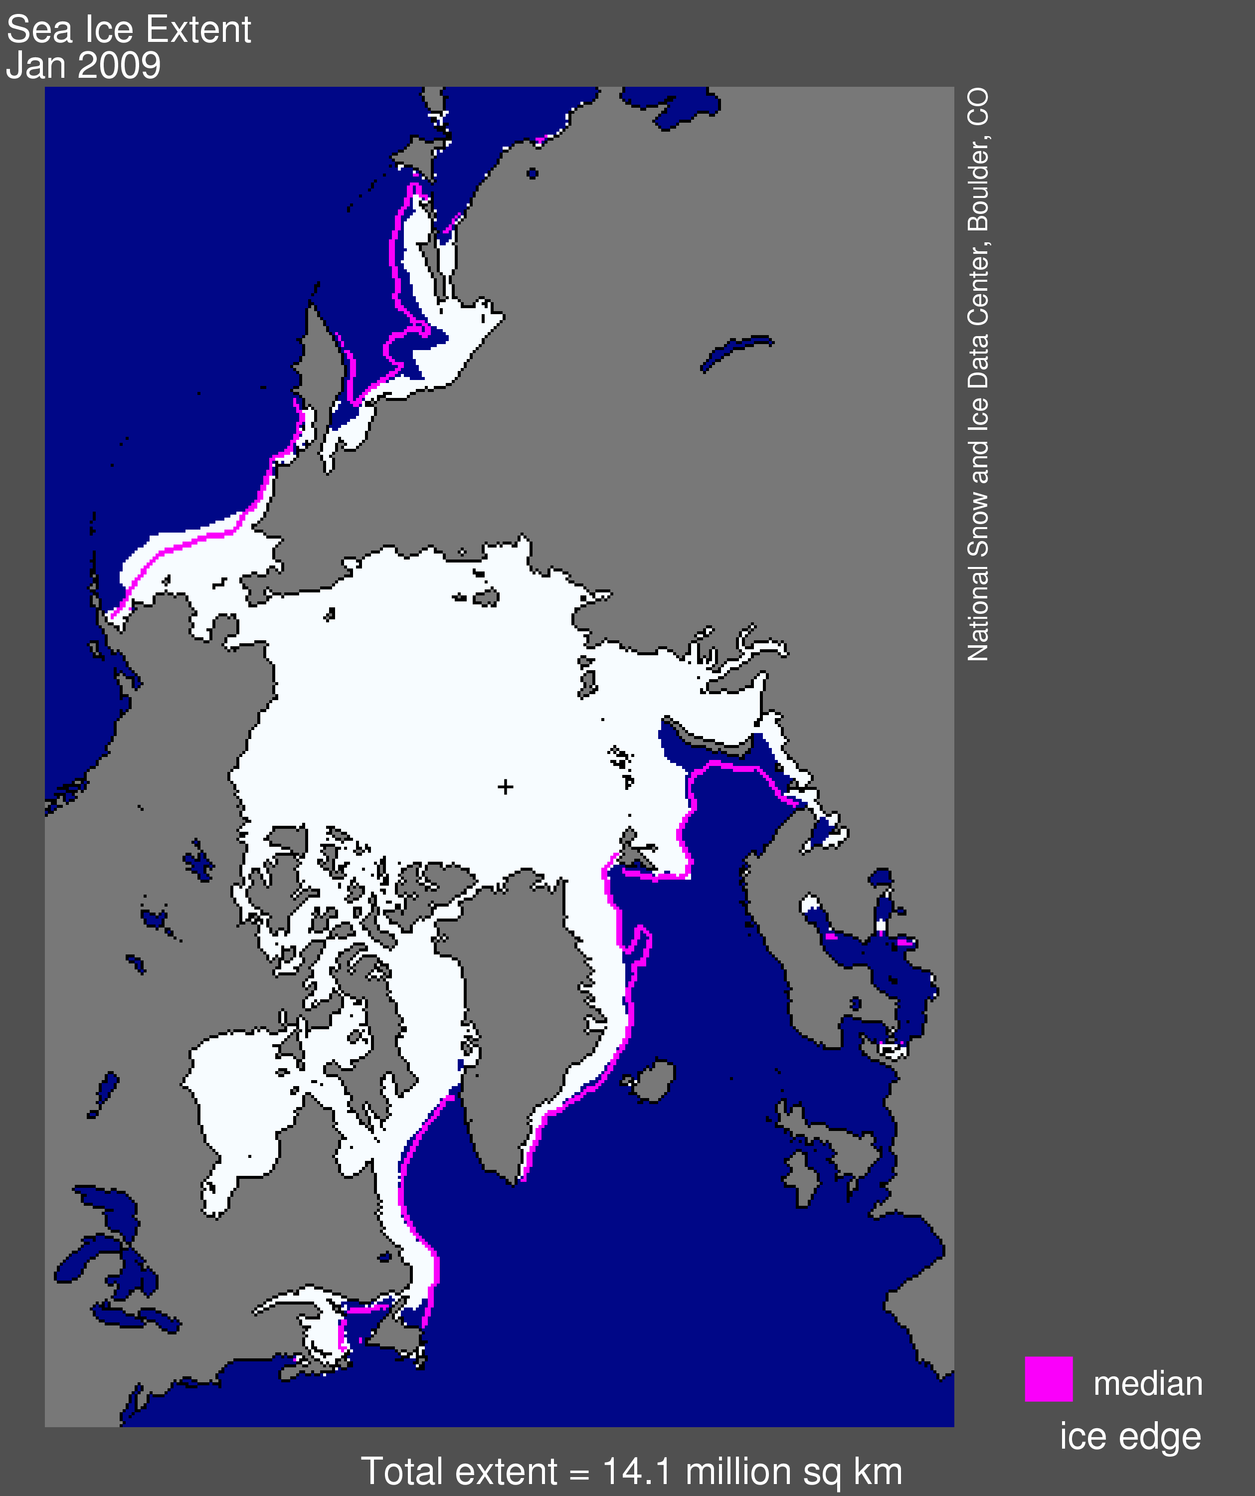
The National Snow and Ice Data Center reported just a few hours ago that although Arctic sea ice extent grew, as is to be expected in winter, during January 2009, sea-ice extent was, nonetheless, the 6th lowest for a January in the satellite record. Additionally, it was 760,000 km2 below the 1979-2000 average. The record for lowest sea-ice extent in a January was set in January 2006.

Monthly January ice extent for 1979 to 2009 shows 2009 as the sixth lowest January on record.
—Credit: National Snow and Ice Data Center
One of the more interesting occurrences this January was the pause in sea-ice growth between January 15-26 . A similar event occurred between December 12-19, 2008. Both times, the cause of the pause was an unusual pattern of atmospheric circulation.
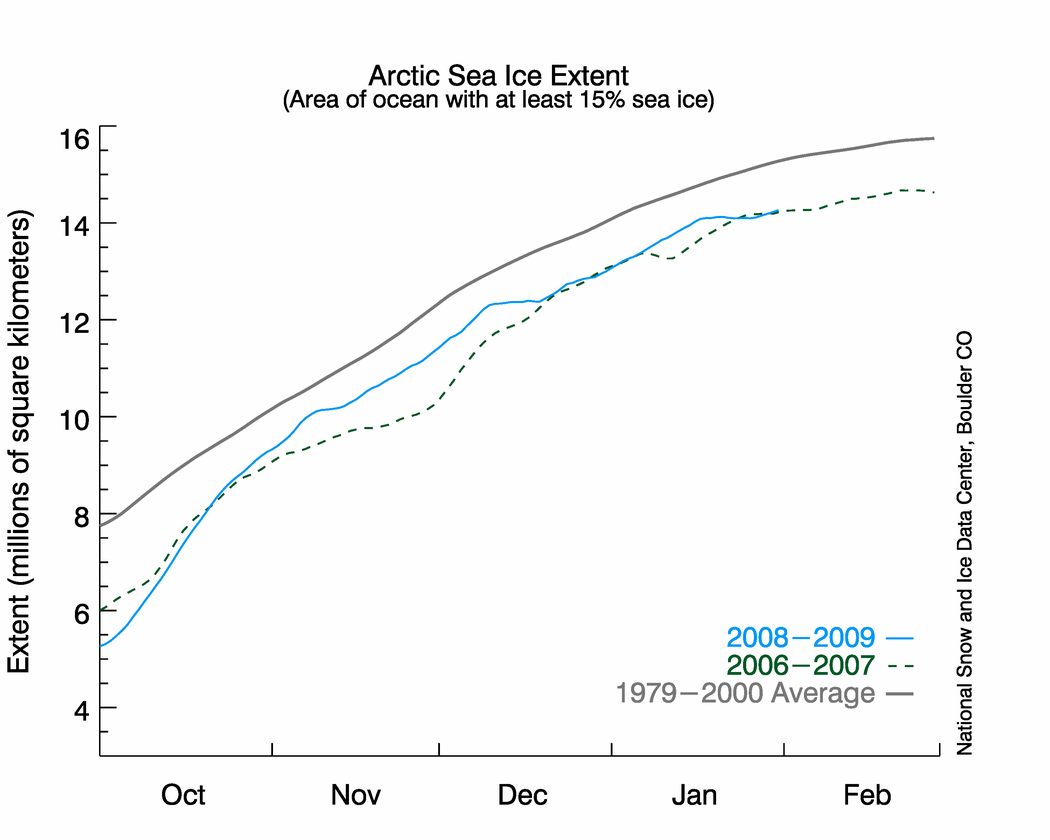
The graph above shows daily sea ice extent.The solid blue line indicates 2008–2009; the dashed green line shows 2006–2007 (the record-low summer minimum occurred in 2007); and the solid gray line indicates average extent from 1979 to 2000. Sea Ice Index data.
—Credit: National Snow and Ice Data Center
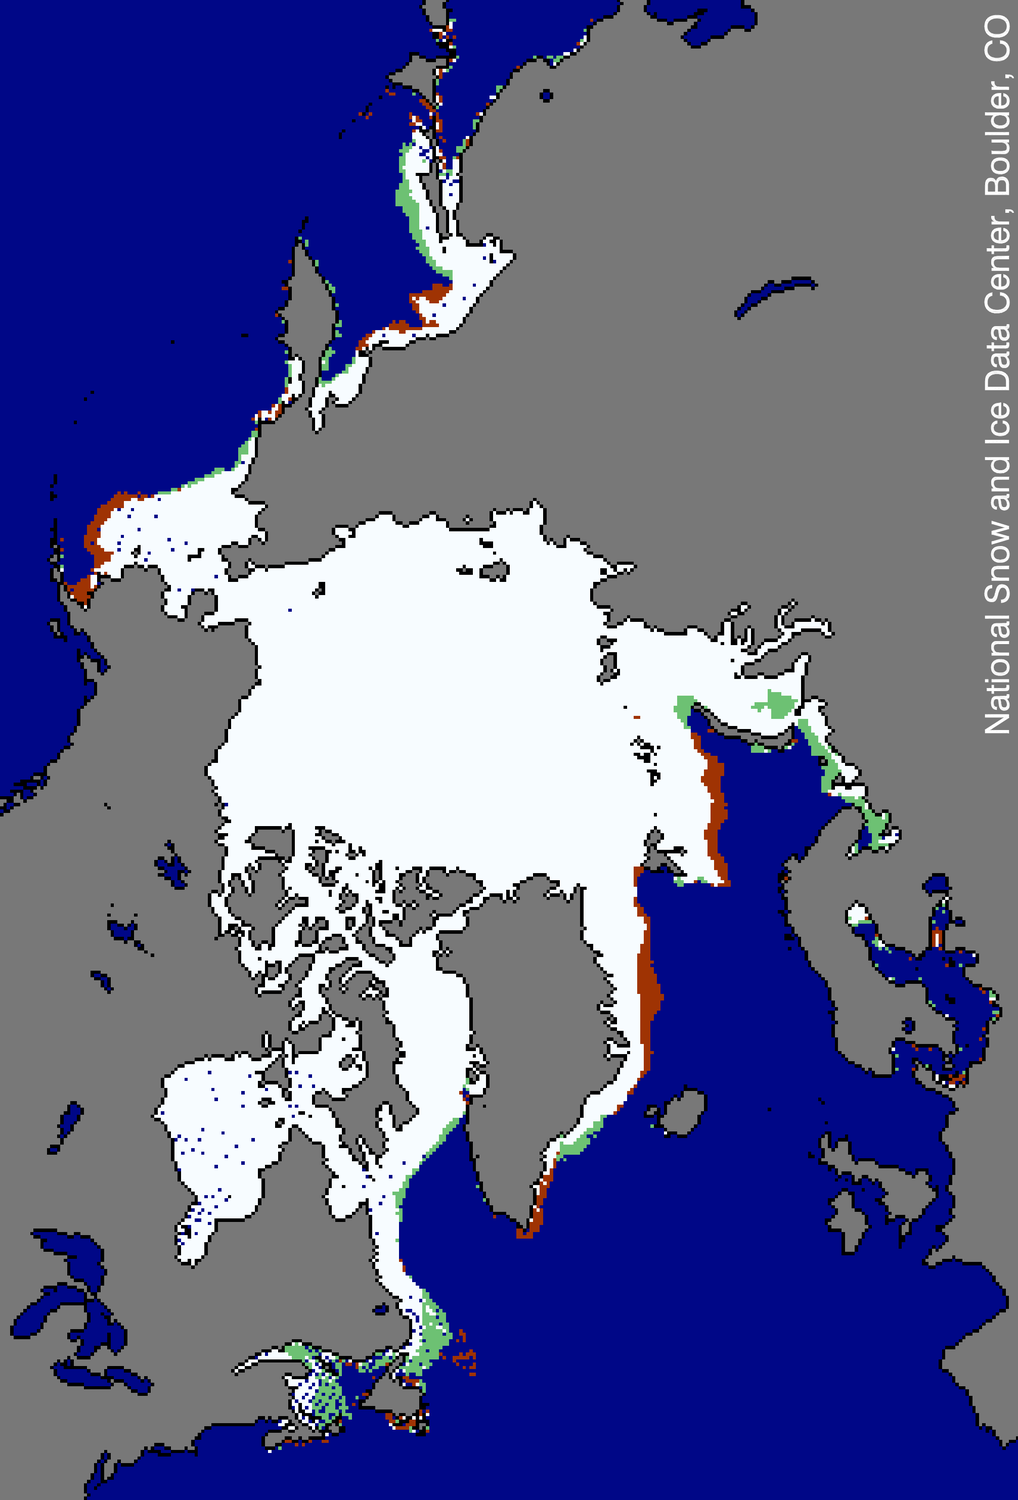
The pause in total sea-ice extent change from January 15 to 26 reflects expanding and declining ice extent in different areas of the Arctic. For example, ice extent increased southwest of Greenland but decreased in areas east of Greenland and in parts of the Barents Sea.
January 15 to 26 saw very strong low pressure centered just south of Iceland—a very strong Icelandic Low. In accord with Buys Ballot’s Law, strong warm winds from the south and southeast encouraged ice decline in areas east of Greenland and in parts of the Barents sea area. The winds helped compact the ice cover and reduce ice growth. Regional winds from the north explain the increases in ice extent southwest of Greenland.
This map compares ice extent on January 15 to ice extent on January 26, 2009. Areas in red indicate where ice was present on January 15 but had disappeared by January 26; areas in green indicate where ice was not present on January 15 but had appeared by January 26. Note in particular the regional balance between reduced ice extent in parts of the Arctic and increased extent in others. Sea Ice Index data.
—Credit: National Snow and Ice Data CenterThis strong Icelandic Low was present at the same time that atmospheric pressures were especially high over the subtropical North Atlantic. This large-scale pattern of atmospheric pressure and the regional pattern of changes in ice extent on the Atlantic side of the Arctic are classic signals of the positive phase of the North Atlantic Oscillation (NAO). The negative phase would have a weaker Icelandic Low, and roughly the inverse pattern of sea ice extent anomalies (the red and green in the figure above would be approximately reversed). The NAO has climate impacts not just in the Arctic, but in North America and Europe as well.
Related Post:
Remarkable Change in Arctic Atmospheric Circulation: Have We Passed a Tipping Point?


Leave a comment